PhD-AECM Dissertation Defense Presentation: Kushagra Varma
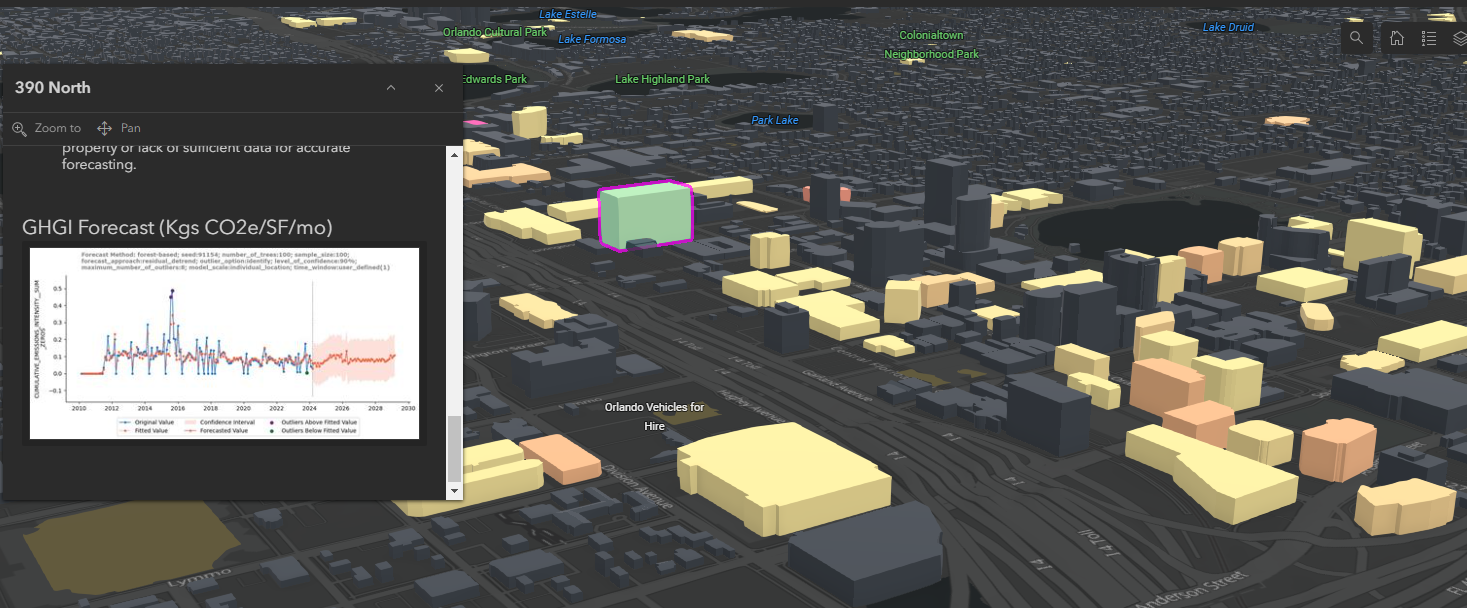
Greenhouse Gas Emissions (GHGI) Forecast. Kushagra Varma, PhD-AECM candidate.
Title: A 4D Interactive Carbon Emissions Dashboard: A Visualization and Assessment Tool for Urban Building Environmental Impact
Name: Kushagra Varma, PhD candidate in Architecture–Engineering–Construction Management (PhD-AECM)
Date: Friday, May 17, 2024
Time: 1:30-3:30pm ET
Location: Intelligent Workplace (IW) Conference Room, MM 415 & Zoom
Dissertation Committee:
Prof. Erica Cochran Hameen, Ph.D., Assoc. AIA, NOMA, LEED AP (Chair)
School of Architecture
Carnegie Mellon University
Prof. Kristen Kurland
Heinz College and School of Architecture
Carnegie Mellon University
Prof. Ellyn A. Lester, Ph.D.
Construction and Architectural Technology Division
Pennsylvania College of Technology
Prof. Vivian Loftness, FAIA, LEED AP
School of Architecture
Carnegie Mellon University
Prof. Peter Scupelli, Ph.D., EDAC
School of Design
Carnegie Mellon University
Abstract:
Buildings continue to maintain their status as one of the largest consumers of energy and water. As of 2024, approximately 60% of electricity generation in the US derives from fossil fuels and releases substantial volumes of greenhouse gases into the atmosphere. This fossil fuel consumption contributes to global warming and the broader issues of the Anthropocene. Moreover, escalating water consumption leads to unsustainable consequences, including increased energy, environmental, and financial burdens. In response, energy and water benchmarking has become a crucial method for evaluating the performance of existing buildings and setting targets for future improvements. The Institute for Market Transformation (IMT) reports that in the United States, as of 2023, 44 cities and 8 states have adopted varied energy benchmarking and transparency policies, with some being voluntary and others mandatory. However, three primary challenges have been identified in these existing policies:
- Lack of User-Friendly Data-Sharing Tools: Most cities and states (fewer than 60%) use a public dashboard for sharing benchmarking data, indicating a gap in tools that are easy to use and engage non-energy experts.
- Absence of Emission Forecasts: No cities currently provide emission forecasts, which are essential for helping stakeholders and policymakers set future emission improvement targets. This omission neglects the temporal dimension of data sharing.
- Inconsistent Dashboarding Standards: There is no coherent standard for developing dashboards to share data across communities, leading to difficulties in comparing, aggregating, and disseminating information across different jurisdictions.
To tackle these challenges, this dissertation introduces a framework for developing a "4D Interactive Carbon Emissions Dashboard: A Visualization and Assessment Tool for Urban Building Environmental Impact." This dashboard not only visualizes existing benchmarking data but also integrates future emission predictions, hence the designation "4D."
This "4D Interactive Carbon Emissions Dashboard'' features a dynamic 3D representation of buildings alongside data on energy, water, wastewater, municipal solid waste, renewable energy, and greenhouse gas intensities. As a result of the dissertation, the framework also provides seven new standalone applications for cleaning and preparing raw data for analysis and dashboarding. Additionally, to provide emission forecasting, various forecasting methods, such as simple curve fitting, exponential smoothing, and a forest-based technique, were tested using energy and water benchmarking data from the cities of Orlando and Pittsburgh. The forest-based method was determined to be the most suitable based on its Forecast Root Mean Square Error (FRMSE) and Validation Root Mean Square Error (VRMSE) values generated using Space Time Pattern Mining Tool’s Time Series Forecasting method in ArcGIS Pro. Furthermore, to make it easier for municipalities throughout the US to share benchmarking data with their constituents, this dissertation provides a detailed, step-by-step methodology for constructing the dashboard from scratch, ensuring a robust and standard approach to data visualization and forecasting.
In conclusion, this dissertation not only identifies critical gaps in current energy and water benchmarking efforts but also offers a data sharing solution through the 4D Interactive Carbon Emissions Dashboard. The tool is designed to enhance the transparency and accessibility of building performance data, enabling more informed decision-making and fostering a proactive approach to energy, water, waste, and wastewater management to reduce emissions. Ultimately, this research contributes to the ongoing dialogue on urban sustainability and provides actionable insights that can drive meaningful environmental change in the built environment.
Keywords: Environmental Benchmarking, Urban Building, Energy, Water, 4D Data Visualization, Building-related emissions, emissions forecasting.